
by Josh Howarth, August 19, 2022
The global agtech market is on the rise.
Adapting consumer demands concerning food production and the improvement of agricultural technology are boosting growth.
With that in mind, we’ll explore the following agtech market statistics:
- AgTech Industry Highlights
- AgTech Market Size
- AgTech Market Growth Projections
- Growth Drivers In The AgTech Space
- Key Players In The AgTech Market
- AgTech Market Geographic Breakdown
- AgTech Growth By Segment
AgTech Industry Highlights
- The global agtech market is worth nearly $20 billion
- By 2030, the global agtech market is expected to surpass $40 billion
- The global agtech market is growing at a CAGR of 10.2%
- The North American agtech market is valued at $7.54 billion
- Precision agriculture is worth over $4 billion
AgTech Market Size
As of 2022, the global agtech market is currently worth $19.91 billion.
Several factors are contributing to the growth of the agtech market, perhaps most prominently growing concern over how food is produced.
Historical data shows that smart agriculture has grown from $9.58 billion in 2017 to $12.4 billion in 2020. And according to BIS Research, the market is expected to grow to $34.1 billion by 2026.
Sources: Precedence Research, Foley, BIS Research
AgTech Market Growth Projections
The worldwide agtech market was valued at $18.12 billion in 2021.
The market is expected to reach $43.37 billion by 2030 at a compound annual growth rate (CAGR) of 10.2%.
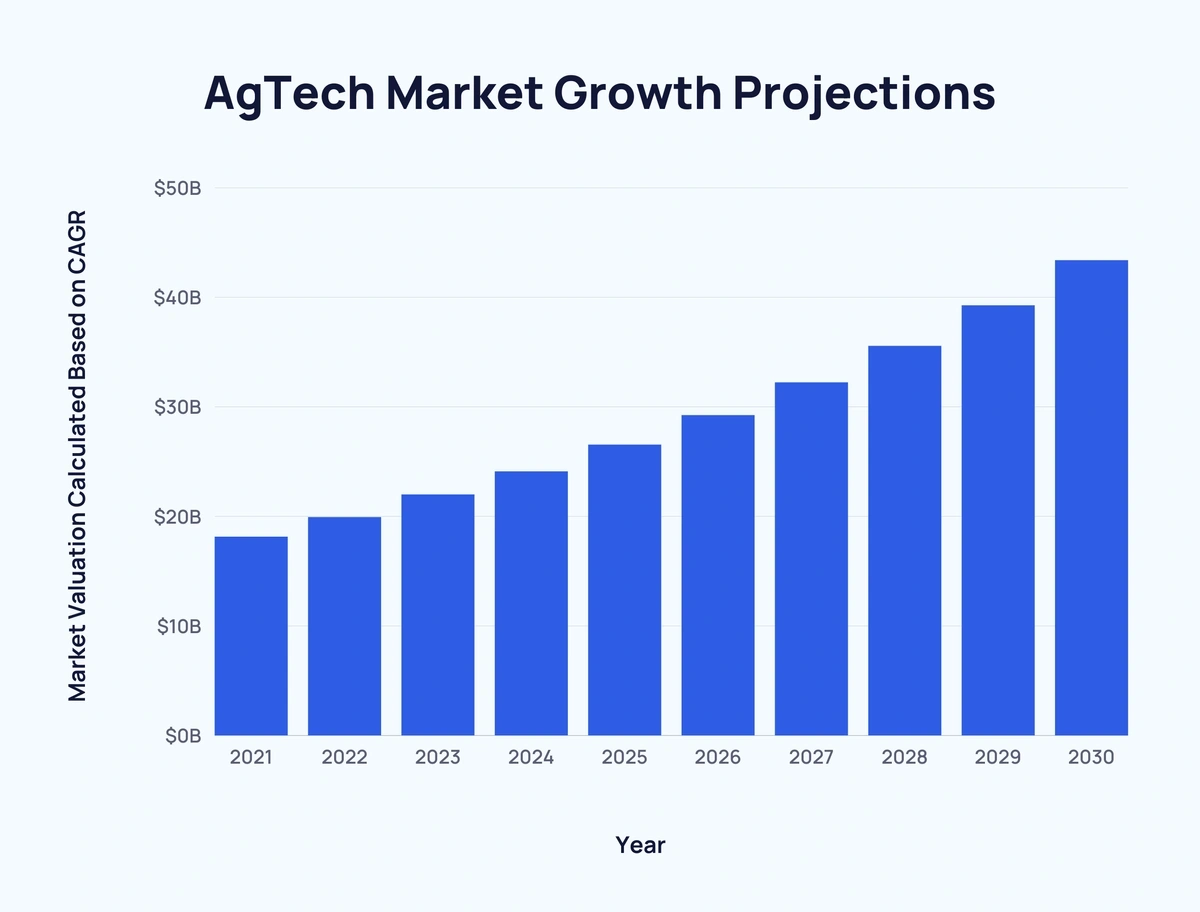
Here’s a closer look at how the agtech market is forecast to grow:
| Year | Market Valuation Calculated Based on CAGR |
| 2021* | $18.12 billion |
| 2022 | $19.91 billion |
| 2023 | $21.98 billion |
| 2024 | $24.08 billion |
| 2025 | $26.52 billion |
| 2026 | $29.22 billion |
| 2027 | $32.21 billion |
| 2028 | $35.54 billion |
| 2029 | $39.25 billion |
| 2030 | $43.37 billion |
*Historical figure
Sources: Precedence Research
Growth Drivers In The AgTech Space
AgTech funding has increased year-over-year between 2018 and 2021 from $1.1 billion to $4.9 billion.
Changing perspectives on the importance of how food is produced is a major driver in the agtech market. Millennials especially are increasingly encouraging companies to find innovative methods of food production (like vertical farming).
Rising disposable income, urbanization, and the aforementioned changing habits have majorly driven demand for agtech applications in China, India, Brazil, and the US.
Sources: Crunchbase, Foley, Prescient & Strategic Intelligence
Key Players In The AgTech Market
- Cargrill (US)
- ADM (US)
- Bayer (Germany)
- AgroStar (India)
- Topcon Agriculture (US)
- DeLaval (UK)
- Trimble (US)
- Apollo Agriculture (Kenya)
- Benson Hill (US)
- Bowery Farming (US)
- Ceres Imaging (US)
- Conservis (US)
- CropX (US)
- Gro Intelligence (US)
- Impossible Foods (US)
- Indigo AG (US)
- LettUs Grow (UK)
- Ninjacart (India)
- Pivot Bio (US)
- Plenty Inc (US)
- AGCO Corporation (US)
- InnovaSea (US)
- Semiosbio (Canada)
- Afimilk (Israel)
- Aker (US)
Sources: Global Banking and Finance, Transparency Market Research, Grand View Research, BizVibe
AgTech Market Geographic Breakdown
As of 2022, the North American agtech market is valued at over $7.5 billion - approximately double that of any other region.
By 2025, this figure will exceed $14 billion. While the next-largest market, Europe, will be just shy of a $6 billion valuation.
Here’s a breakdown of the agtech market by region according to Juniper Research data:
| Year | North America | Europe | Far East & China | Latin America | Rest of World | |||||
| Value | Share | Value | Share | Value | Share | Value | Share | Value | Share | |
| 2020 | $5.2 billion | 57.2% | $2.5 billion | 27.5% | $598 million | 6.6% | $46 million | 0.5% | $746 million | 8.2% |
| 2021 | $6.22 billion | 59.3% | $2.79 billion | 26.6% | $665 million | 6.3% | $42 million | 0.4% | $781 million | 7.4% |
| 2022 | $7.54 billion | 60.8% | $3.29 billion | 26.5% | $726.6billion | 5.9% | $47 million | 0.4% | $803 million | 6.5% |
| 2023 | $9.25 billion | 62.2% | £3.92 billion | 26.4% | $808 million | 5.4% | $53 million | 0.4% | $837 million | 5.6% |
| 2024 | $11.46 billion | 62.9% | $4.8 billion | 26.3% | $933 million | 5.1% | $59 million | 0.3% | $979 million | 5.4% |
| 2025 | $14.31 billion | 63.4% | $5.95 billion | 26.4% | $1.1 billion | 4.9% | $67 million | 0.3% | $1.15 billion | 5.1% |
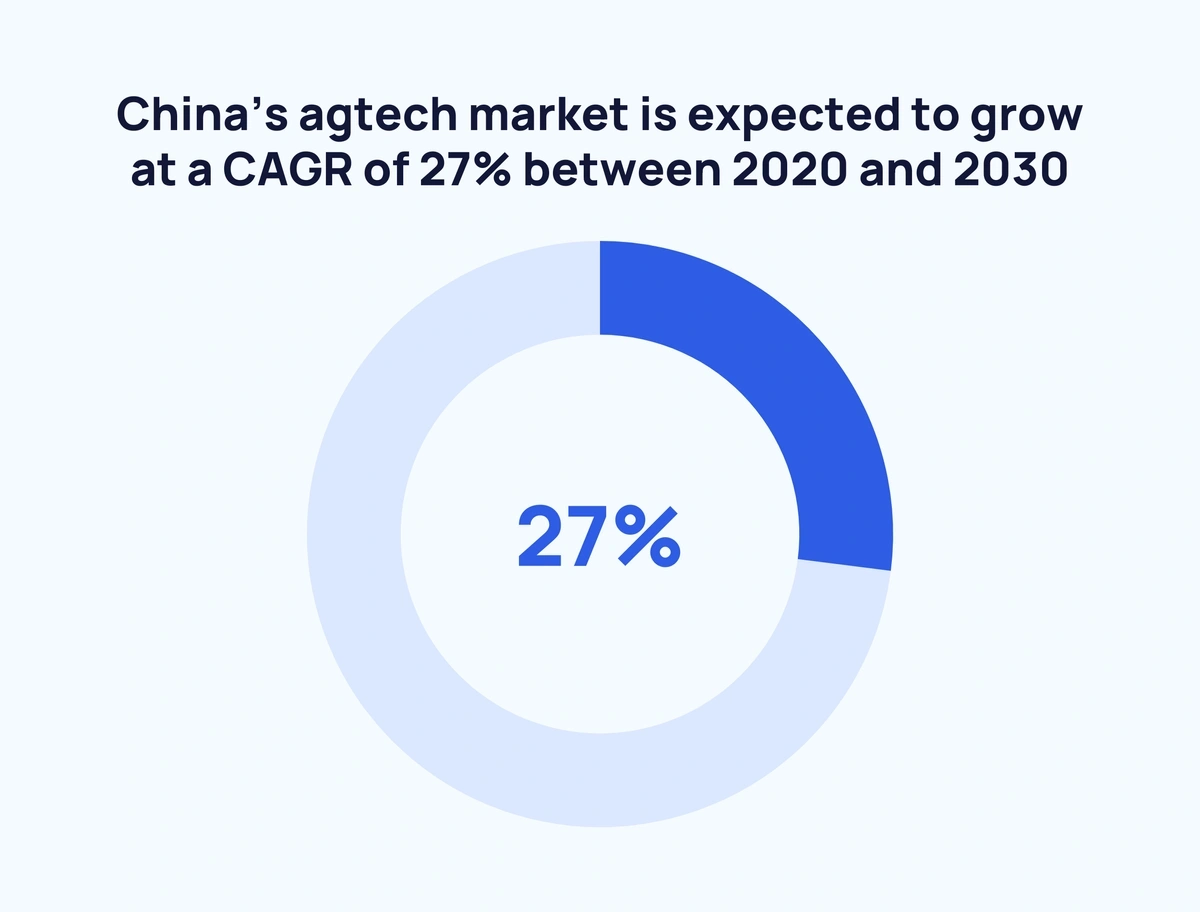
Although not specifically represented in the data above, the Asia-Pacific region is predicted to be the fastest-growing agtech space. The increased adoption of agricultural AI in major nations including India, China, Australia, and Japan is largely behind this. China’s agtech market is expected to grow at a CAGR of 27% between 2020 and 2030.
Sources: Juniper Research, P&S Intelligence
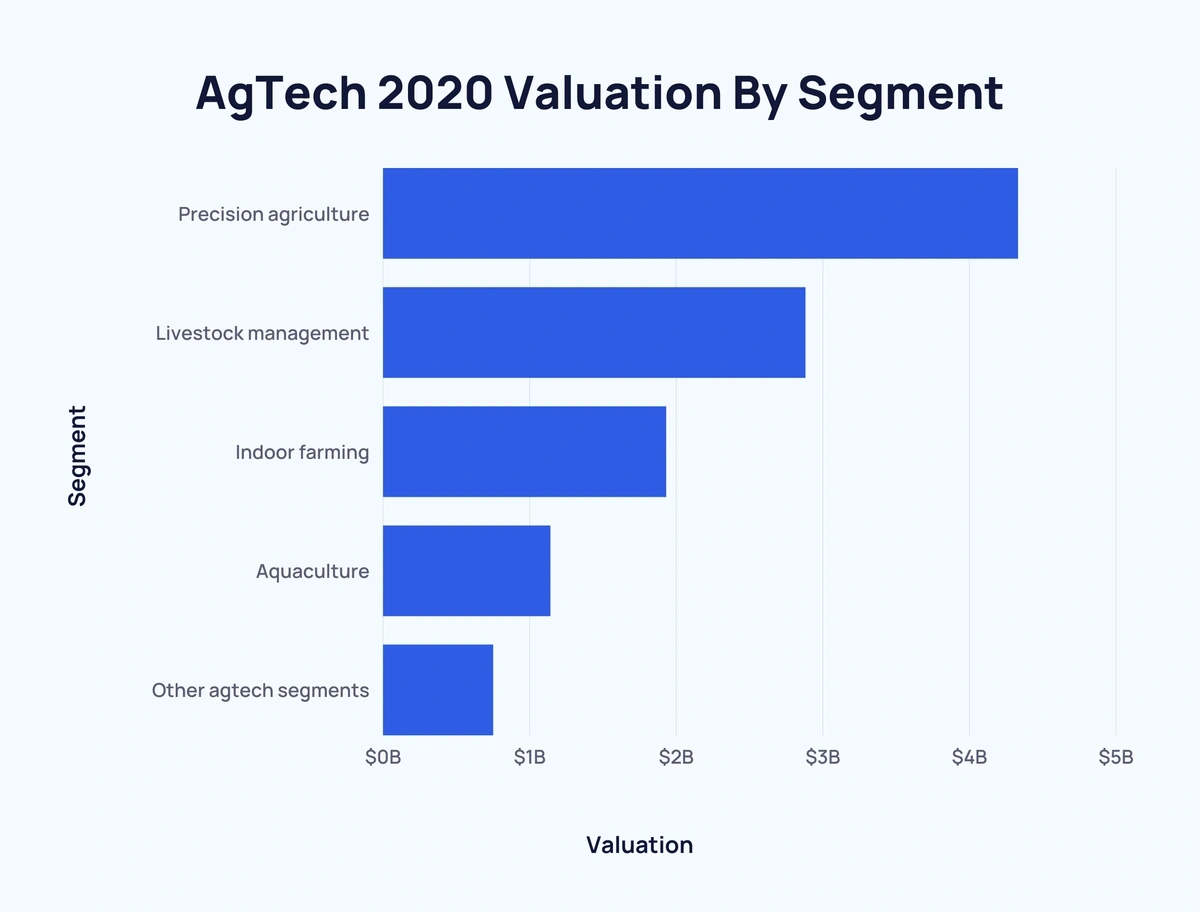
AgTech Growth By Segment
The agtech market can be broken down into a few key segments. According to 2020 data, precision agriculture is the largest of those segments, valued at $4.33 billion.
This was followed by livestock monitoring and management ($2.88 billion), indoor farming ($1.93 billion), and aquaculture ($1.14 billion). Other agtech segments totaled $0.75 billion.
The order of valuation is projected to remain the same, but those valuations are expected to at least double across the board by 2026.
- The precision agriculture space is set to increase almost 3x to $11.88 billion
- Livestock monitoring and management is predicted to nearly triple, reaching $7.98 billion
- Indoor farming is expected to grow by over 175% to hit $5.32 billion
- The aquacare segment is projected to grow by around $2 billion to reach a valuation of $3.11 billion
- The other segments of the agtech market will more than double ($1.98 billion valuation)
Within the precision farming space, six applications are expected to grow at a CAGR of over 11%. Precision spraying is the fastest growing application with a CAGR of 15.38% between 2018 and 2025.
Sources: BIS Research
Conclusion
The agtech industry is growing in valuation year-over-year as investment gathers pace.
Changing consumer demands and an improvement in technology within the space are presenting new opportunities for growth within the market.